Qualtrics - How to Read Results
Getting Started
- After logging in to Qualtrics, use the three-line icon in the upper left-hand corner to click on 'Projects'.
- Find the survey you are interested in.
- Select the survey you just activated by clicking on its title.
Getting Started with Data and Analysis
- Click on 'Data and Analysis' towards the top.
Using the Data and Analysis tab, users can filter, classify, merge, clean, and statistically analyze their response data. This can be done using four different sections: data, text iQ, crosstabs, and weighting. However, for most users, the key section involved in reading results is the 'Data' section of 'Data and Analysis'.
Data Section
Most filtering, classifying, merging, importing, and data cleaning activities take place under the Data section.
- Click on 'Data' under 'Data and Analysis'
- To facilitate data analysis, users can click on the 'Export and Import' dropdown menu to export data by clicking on 'Export Data', selecting the appropriate file format, and clicking 'Download'. This way, users can then upload their results to other data processing programs.
- Otherwise, users will need to review results by looking at 'Recorded Responses' which are complete and 'Responses in Progress' which are incomplete. Users will need to individually access each response by clicking on the drop-down arrow under 'Actions' in the row corresponding to each response and selecting 'View Response.' From there, users can go through each answer one-by-one by clicking on the arrow that appears at the bottom of the window that is generated. The window will show all the questions and responses that appeared for each individual respondent, the duration of their response time, a date and time for when their response was recorded, and usually location data.
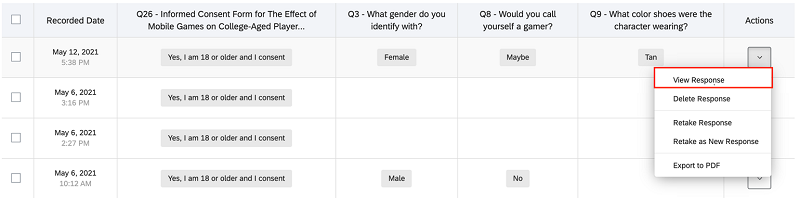
- Users can also click on the dropdown arrow underneath the actions column for each item to delete responses, view responses, retake responses or export the individual response as a PDF.
- Using the 'Tools' dropdown menu, users can save column layouts, or set up projects as a supplemental data source.
- To sort, hide, and move columns, simply click on the header for each column and select the appropriate choice.
Getting Started with Reports
- After logging in to Qualtrics, use the three-line icon in the upper left-hand corner to click on 'Projects'.
- Find the survey you are interested in.
- Select the survey you just activated by clicking on its title.
- Click on 'Reports' towards the top. You will automatically be in the 'Results' tab.
There will be a 'Results' and 'Reports' tab. The 'Results' tab allows you to quickly view and analyze your results in a default report consisting of question-based pages and customizable visualizations. The 'Reports' tab allows you to format reports and better control the layout. For the purpose of reading results, the 'Results' tab, and in specific a 'default report', should suffice.
Results Section
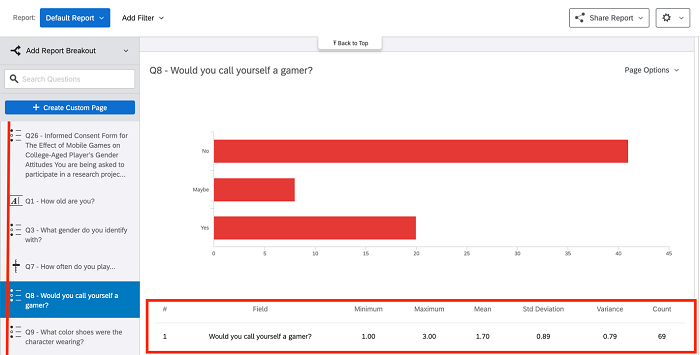
When you initially click on the 'Results' tab, a default report will open. Here you will see a list of your questions on the left-hand side. You can scroll down, click on a question, or search for a question in the search field, to see relevant data for each question. This includes a graph depicting response choices and descriptive statistics such as minimum, maximum, mean, standard deviation, variance, and count.
- By default, every question in your survey will have its own page. You can edit these default pages or create your own custom pages by clicking on 'Create Custom Page' and then selecting the specific page to edit it.
- To look at a specific subset of your data, click on 'Add Filter' and choose the filter criteria, which can be survey metadata, question, or embedded data. You may also simply select 'manage filters' next to 'saved filters' to create a new filter. You will then need to enter a title for your filter. Then either select 'All' of the following are true or 'Any'. 'All' means that all conditions must be met. 'Any' means that at least one condition must be met. Select a field from either survey metadata, contact fields, embedded data, or questions. From there, select an operator, which is used to launch your decision criteria, and fill out the appropriate operand in the field that appears. Then input an operand, which can be a numeric value or keyword that finishes off your conditional statements. To add additional conditions or remove conditions click the plus (+) or minus (-) sign to add additional conditions or remove conditions. This will bring you to the manage filters window. In this window, to add more filters, click 'Insert New Condition'. To organize related filters into subcategories, select 'Insert New Condition Set'.
- For reference, data visualizations display your survey data in easy-to-digest charts, graphs, and tables. To add a data visualization or change the default one, select the 'Add visualization' button underneath the selected question. In the window that is generated, select a visualization and customize your visualization to your liking. Users can select from a gauge chart, statistics table, breakdown bar, pie chart, line chart, bar chart, and a simple table.
- To add images and text to your visualization, navigate to the bottom of your desired page and click 'Add Note'. From there, use the rich text editor to type your message. You can also add an image by clicking on the picture icon.
- To remove this note or visualization, select the three dots on the upper right-hand corner and select 'Remove Visualization'. This three-dot menu also contains an 'Export' button.
- The 'Share Report' button lets you share your report as a PDF document, word document, PowerPoint side, or CSV. You can also download previous exports from the 'Share Report' drop-down menu, as well as schedule a report email.
- The gear icon includes report settings where you can determine the default settings for your report, including applying custom color palettes and charts to your data visualizations. Here the response counts will also appear. Finally, this drops menu also allows you to edit your report, hide all pages, and delete your report.
More about the 'Results' tab of the 'Reports' section is covered in other documentation.